


Messy spreadsheets. Endless rows of numbers. Charts that look impressive but explain nothing. For many people, this is what “working with data” really feels like.
Turning raw data into a clean, useful dashboard should bring clarity — but instead, it often feels slow, technical, and overwhelming. The insights are there, but getting to them takes time, tools, and skills you may not feel confident about yet.
That’s exactly where Gen AI changes everything.
Gen AI removes much of the manual work and complexity from dashboard creation, helping you move from raw data to clear visuals faster and with far less stress. In this blog, you’ll see how Gen AI simplifies the entire dashboard-building process and how you can start creating meaningful dashboards with confidence, even as a beginner.
What Does “Raw Data” Really Look Like?
Raw data is simply information that hasn’t been cleaned or organized yet. It’s real, but not yet meaningful — more like a rough draft than a final report.
You might see it as a giant spreadsheet of sales transactions, a marketing export full of campaign numbers, a list of customer details and feedback, or an operations log showing orders and deliveries. All the information is there — just not in a way that’s easy to understand.
Raw data usually means:
- Lots of rows and columns
- Formats that don’t match
- Insights that are hidden rather than obvious
So even if the data is valuable, it doesn’t feel useful yet.
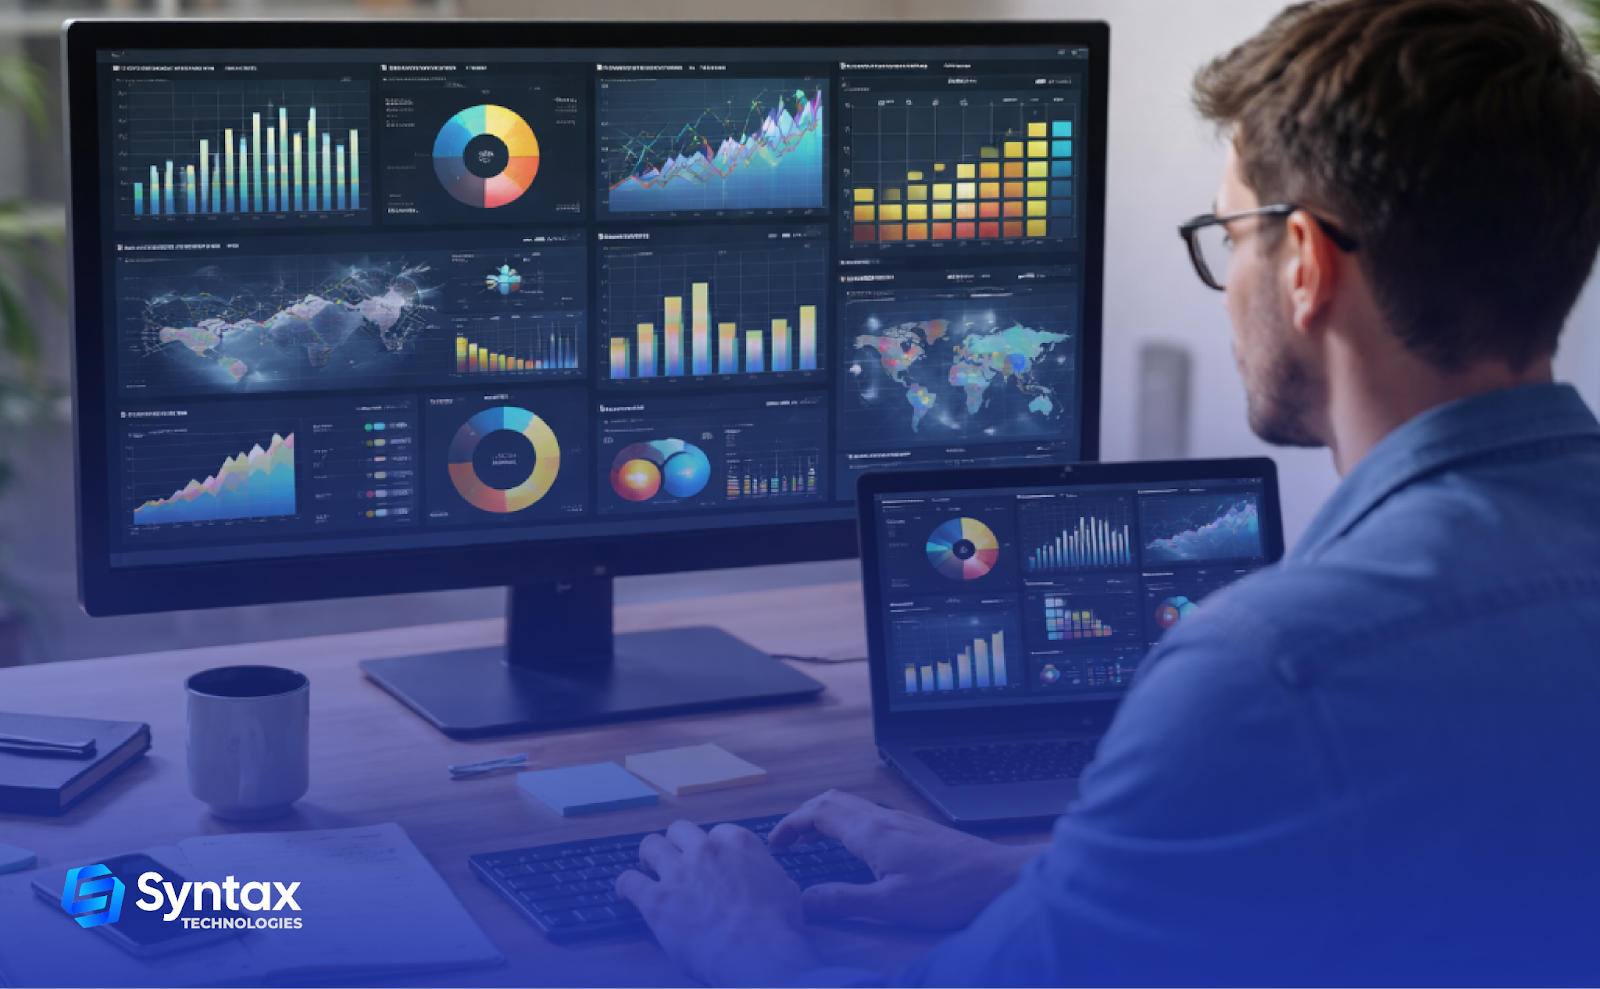
That’s why visualization matters. Dashboards turn those rows of numbers into charts and summaries that instantly show trends, patterns, and problem areas. Instead of searching for meaning, you can finally see it at a glance.


Traditional Dashboard Building: Why It Feels Slow and Complex
Traditionally, building dashboards involved a lot of manual work.
The usual process looked something like this:
- Clean the data manually
- Write formulas or calculations
- Decide which charts to use
- Adjust layouts and formatting
- Repeat until things look right
For beginners, this often leads to:
- A steep learning curve
- Confusion over which chart fits which data
- Endless trial and error
This is the frustration Gen AI directly addresses.
How GenAI Transforms Data Visualization
Gen AI, in the context of data visualization, acts like a smart assistant that helps you work with data using plain language. Here’s how Gen AI helps at each stage:
- Understanding data faster
Gen AI can quickly scan your dataset and explain what’s inside—key columns, patterns, and potential issues—without you digging through every row.
- Suggesting the right charts
Instead of guessing, Gen AI recommends visuals based on your data:
- Trends over time? Line chart.
- Comparisons? Bar chart.
- Distribution? Histogram.
- Writing formulas using plain English
Instead of struggling with complex logic, you can simply say:
“Show total sales by month”
Or
“Compare revenue by region”
Gen AI translates this into the required calculations behind the scenes.
- Generating insights and summaries
Rather than just showing visuals, Gen AI can summarize what’s happening:
- “Sales increased steadily in Q3”
- “Customer churn is higher in one specific region”
- Speeding up design and layout
Gen AI can auto-generate dashboard layouts that are clean, readable, and presentation-ready—saving hours of formatting work.


Benefits of Using GenAI for Dashboard Creation
- Faster dashboard creation without manual effort
- Lower technical barriers for beginners
- Better data storytelling, not just charts
- More confidence when working with data
- Less time formatting, more time understanding insights
Real-World Impact: Why These Skills Matter Today
Gen AI-powered dashboards are already being used across teams:
- Business leaders use them to make faster decisions
- Marketing teams track campaign performance in real time
- Sales teams monitor targets and pipelines
- Product and operations teams identify bottlenecks and trends
Professionals who can turn data into clear visuals—and explain what it means—are becoming increasingly valuable.
Conclusion
Going from raw data to meaningful dashboards no longer has to feel technical or intimidating. Gen AI removes much of the complexity, helping you clean data, choose the right visuals, and spot insights faster — even if you’re just getting started.
You don’t need to be an expert to do this. With the right guidance and a bit of practice, you can turn messy spreadsheets into dashboards that actually make sense.
If you want structured, hands-on support while you learn, the Advanced Data Visualization with GenAI workshop is designed to help beginners build real-world dashboards using Gen AI — at your own pace, with simple, practical learning